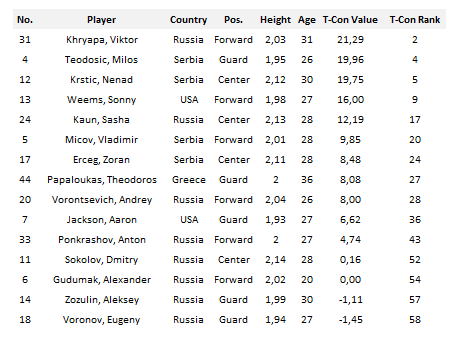
After the last season, CSKA Moscow is in the Final Four again. As we all can remember, last game of the 2011-12 Season was devastating for the Russian Powerhouse. They may have lost great players from last season's roster, yet they are still one of the most dominating team in the European League. Let's start CSKA Moscow analysis with the team's roster.
In the last column, T-Con Ranks show the ranking of the player in terms of his tangible contribution. Remember these ranks shows the players place in only Final Four teams' players. CSKA has 3 player (Khryapa,Teodosic,Krstic) in Top 5 players and 1 more player (Weems) in Top 10 players. It's obvious that they have great Starting 5.
Next, we analyzed the all team's point guards' play making abilities. Let's look how good is the CSKA Moscow's commanders;
Remember, this stat show point guard's play making abilities. So, players which tend to create more offensive opportunities for his team mates get better scores. We've found their ranking in both all-players of Euroleague and all-players of Final Four Teams. Papaloukas is at the top on Final Four list. Also, starting point guard Teodosic is one of the Top 3 point guards which shows CSKA would have the advantage for smoother offense in following games.
After play making abilities, shooting analysis is the next. We analyzed all players in term of shooting abilities and determined the Top 5 shooters for all teams. Let's find out who are the CSKA's top shooters.
There are two different type of Shooting Values (SV). First one (SV1) includes both 3-pointers and middle range shoots. They are weighted differently by their profits of course. MR Value and 3P Values are the values that shows weighted players' shooting accuracy by considering their opponent's shot-defending stats. MR Vol. and 3PA Vol. represent value of how many shots players have taken to reach their field goal percentage. As I've mention in previous post, I've formed a shooting distribution to find these scores. Ranks are combination of these Shooting Values and Shooting Volumes. On the other hand, second Shooting Value (SV2) take only 3-pointers and volume of 3-pointer shoots into consideration.Same combination logic applied these stats to find 3-pointers ranks.
We also made a rebounding analysis to understand team's success at the rebounds.
I've mentioned in the Prologue post how we calculated rebound rates. When we look at the ranks, we can easily see that best rebounder of the Euroleague is in the CSKA's roster,Khryapa. They also have one more player who is one of the Top 10 rebounders in all Final Four players,Krstic. It shows, CSKA would probably have no problems in the front court.
It's time to shows how is CSKA doing in TDR and TOR rankings.
Table above, shows how CSKA's TDR scores changes while Euroleague advances and what was the average TDR scores in every phase they've passed. Till the Playoff, CSKA was always above the EL Av. Yet, they were under the average in the playoffs which is a little bit alarming for them. The graph below shows this progress.
As for offensive efficiency, TOR scores of the CSKA are showed at the table below.
Unlike TDR, CSKA was above the Euroleague average in every phase they played. Not only that, but also it's clear that they increased their offensive efficiency while the tournament advances.
Now, last but not least Play Oriented Winning Percentages. As I've mentioned before, these percentages are formed by developing team's play oriented winning function and comparing these functions to their opponent's functions.Thus, I was able to determine number of plays that are good and bad for each teams. Let's start with the first game of the CSKA;
Game Function shows the function of the CSKA Moscow vs Olympiacos games' function as the name implies. First Breaking Point (FBP) of this game is 66 play per team. Second Breaking Point (SBP) of the game is 85 play/game. Let's find out how these breaking points chances teams' winning chances. That tells us between 66 number of play and 85 number of play CSKA has the advantage. Yet, below the 66 number of play ( which is almost impossible for a game to finish with that much low number of plays) and above 85 number of plays Oly gets the advantage.However, since Oly prefers low pace games, it would be harder for them to compete with CSKA. Now, let's look at the breaking points of other potential match-ups.
It seems that CSKA has its comfort zone between 60 and 85 number of plays. Euroleague average for this season is approximately 80 number of plays by the way which proves that CSKA fans has every rights to claim championship.
_____________________________________________________________________________
*: Points
**: Possessions
Note: Every analysis ,which is conducted for all players of the Euroleague, is applied for the players who had played at least 15 game in the Euroleague this season.


No comments:
Post a Comment