

Basketball Analysis and Extraordinary Stats From Two Engineer
Showing posts with label Top 16. Show all posts
Showing posts with label Top 16. Show all posts
Saturday, March 23, 2013


Tuesday, March 19, 2013
TDR Ladder Week 11
Here is Team Defensive Rating* Ladder based on teams' TOP 16 defensive performances.

* We adjusted some details. That is more proper.
Sunday, March 10, 2013
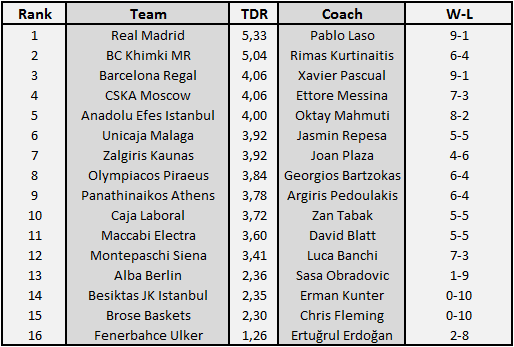
TDR Ladder Week 10
Here is Team Defensive Rating Ladder based on teams' TOP 16 defensive performances.
Sunday, March 3, 2013

Friday, February 8, 2013
TDR Ladder Week 6
In older posts we had tried to rank all-times defensive teams with TDR formula. And after now we will post every week TDR Ladder for TOP 16 performances. The ladder made from last 6 weeks performances here in this post.

Sunday, January 20, 2013
Who Runs The Show Better ?
The game is changing, player roles and expectations from each positions are changing every year in basketball. And also coaches always want extra features from point guards. Shoot uncontested 3 balls, shuffle defense, steal, take fouls, make layups and some floaters of course. These can change in years but playmaking role for point guards will never change.
Now in TOP 16 there are 24 points guards who have major roles for their teams (24 point guards each are playing +20 min per game). And we tried to rank these players' playmaking abilities with numbers. Of course, there can be some points we missed or we couldn't measure right now.
After some researches we selected some important advanced stat which is contributed before by statisticians and that suits our thoughts uterly. And also we tried to produced some stats to rank players playmaking ability. Here are the stats we used.
1-Assist Rate: That formula works to fix players' assists percentage up to teams' pace. That is a rate between players' assists and teams' possessions while player on the court. #1 is Thomas Huertel, #2 is Dimitris Diamantidis.
2- % Pass: That is the part of Bob Chaikin's touches stat.It refers" the percentage of a player's touches that ended with him passing to a teammate in an attacking position on the floor". Here, there is an assumption, Bob Chaikin assumes approximately 1 of 5 passes of player ends with an assist. Players who made more assist with less touches would be at the top of the list. #1 is Evangelos Mantzaris, #2 is Omar Cook.
3-Turnover Rate: That is different from usual TO rate. Usual one is not sufficient to contribute players' offensive activeness which is the risk taken for turn the ball over. It's a fact that players who are more active in the offense are more likely to make turnovers. So,it would be unfair to interpret ballhandling skills with only turnover numbers. But with our turnover rate, we've almost eliminated that problem. Thus, this gives more realistic results. #1 is again Evangelos Mantzaris(he losses 0,4 ball per game!!), #2 is Bobby Brown.
4-AST. Part I: This formula is assist part of Dean Oliver's Points Produced advanced formula. Assist part measures how much player "produces" score with his assists per scorring possessions. So it gives players' assists' productiveness .#1 is Bobby Brown, #2 is Dimitris Diamantidis.
5-AST. Part II: Again it is Dean Oliver's product. That one is part of scorring possessions formula. He says about that "Ast part gives how easy player made the shots for teammates". Actually it's kinda true, but also it depend on other players in the team and formula ignore it a little.#1 is Omar Cook, #2 is Dashaun Wood.
RANKING: After each rates have been found, players rates are aligned in order and found where these rates fit between 0 and 1 in normal distribution. After done that for each component, ranks sum up for overall rank.
Now in TOP 16 there are 24 points guards who have major roles for their teams (24 point guards each are playing +20 min per game). And we tried to rank these players' playmaking abilities with numbers. Of course, there can be some points we missed or we couldn't measure right now.
After some researches we selected some important advanced stat which is contributed before by statisticians and that suits our thoughts uterly. And also we tried to produced some stats to rank players playmaking ability. Here are the stats we used.
1-Assist Rate: That formula works to fix players' assists percentage up to teams' pace. That is a rate between players' assists and teams' possessions while player on the court. #1 is Thomas Huertel, #2 is Dimitris Diamantidis.
2- % Pass: That is the part of Bob Chaikin's touches stat.It refers" the percentage of a player's touches that ended with him passing to a teammate in an attacking position on the floor". Here, there is an assumption, Bob Chaikin assumes approximately 1 of 5 passes of player ends with an assist. Players who made more assist with less touches would be at the top of the list. #1 is Evangelos Mantzaris, #2 is Omar Cook.
3-Turnover Rate: That is different from usual TO rate. Usual one is not sufficient to contribute players' offensive activeness which is the risk taken for turn the ball over. It's a fact that players who are more active in the offense are more likely to make turnovers. So,it would be unfair to interpret ballhandling skills with only turnover numbers. But with our turnover rate, we've almost eliminated that problem. Thus, this gives more realistic results. #1 is again Evangelos Mantzaris(he losses 0,4 ball per game!!), #2 is Bobby Brown.
4-AST. Part I: This formula is assist part of Dean Oliver's Points Produced advanced formula. Assist part measures how much player "produces" score with his assists per scorring possessions. So it gives players' assists' productiveness .#1 is Bobby Brown, #2 is Dimitris Diamantidis.
5-AST. Part II: Again it is Dean Oliver's product. That one is part of scorring possessions formula. He says about that "Ast part gives how easy player made the shots for teammates". Actually it's kinda true, but also it depend on other players in the team and formula ignore it a little.#1 is Omar Cook, #2 is Dashaun Wood.
RANKING: After each rates have been found, players rates are aligned in order and found where these rates fit between 0 and 1 in normal distribution. After done that for each component, ranks sum up for overall rank.
 |
| Check results from full size by clicking the picture. |
When you look at the results, who wants or who is better in running teammates like Omar Cook, Dia, Teodosic is in the top of table as we wanted in the beginning of work. Moreover, in the deep of table there are some guards who better in the other roles like Popovic, Earl Calloway, Teddy Gibson. (Recall, that work tries only rank playmaking ability of guards not all packages of point guards.)
Thursday, January 10, 2013
I Know What Did You in Last 5 Top 16
 Now in Top 16, every team is trying to upgrade plays for championship. There is none definite favourite team like last years CSKA-they couldn't win championship but they were favourite by far even the beginning of season and even the end of season-.There is alot of candidates for F4 in this season and also there are some serious teams waiting to fall them.
That work I did isn't a hard or advanced work but it will put some light to F4 mission. There are some charts -are constituted by basic stats for this time- on the right and left. I put only last 3 years numbers because of lack of space. But result tables contain last 5 years outcomes.

Tables are deployed below contains averages of each selected stats and total averages for years and teams. Green backgrounded 2,4 number in STATS(offense) TOP16 chart is average of all last 5 years finalist teams' 2pt% rank. It is green backrounded because 2,4 is the lowest -which mean the best- one between all average components. Same rules are valid for defense chart. The last AVE rows indicate averages of each column for champions, finalists, 3rd teams and 4th teams. If try to sum something up from these two tables, champion team has best defensive averages between F4 teams in top 16. Therefore we can say that tables show the achievement comes a little bit more with defense.


In addition, how many champion team get into first 5 team in selected stats in 5 years is indicated following two tables. 4 of last 5 champions had one of best teams in turnover, opponents 2pt% and opponents scored points. Hence these tables point out defenses significance. Do not lose ball, defend well 2pt shot attempts, force your opponnets made less points, here you are a champion. It is very simple like you see (!)

Wednesday, December 26, 2012
Best of the Worst 8
Group phase -or should we say training phase- of the Euroleague 2012-13 Season has completed. 16 team will continue to their march while 8 team are returning their homelands. Their fans are probably unsatisfied and most of them claims their team was better than others. Now let's analyze the unhappy 8 teams first before the Top 16 phase, because we will have enough time to analyze happy ones.
First of all this is not Euroleague team power rankings. This team index formed by analyzing how the team's showed their performance against their opponents and how they stopped their opponents for every group game they played. Every statistic -whether about team's own performance or about how they handle their opponents - is awarded or penalized regarding their opponents normal Euroleague performance. So, if two team produced even identical statistics, the one with the tougher opponent would forge ahead.
Number 8
 Cedevita Zagreb is the one who showed worst performance considering their opponent's performance. Probably, the fact that one of their opponents are one of the worst team in this list, played a great part in their place. They were way behind in the Top 16 race.
Number 7
 Disappoinment. It's the only word when think about Milano. They have just an amazing roster. Nobody seems to understand what is their problem and it's another subject for a detailed analyze. However, they deserved the worst second team title considering their performance. If I had to cross check every team in the list with their roster quality, they would be clearly the worst team.
Number 6
 First of all, they have the best team logo in Euroleague. They showed some fragments of solid performances , however they advanced here from Eurochallenge, let's give them a break.
Number 5
 After a huge disappointment at last year, they were finaly in the group phase this year. Yet, they weren't very impressive this year too,unfortunately. Group D was probably the easiest group to advance. There were two team who will beat all the other teams in the group and the other four teams were about the same potential. They blowed their chance, and now they are in the middle of the unhapy list.
Number 4
 It wasn't the best year for Polish champion, they were at the last place in Group B. They weren't too bad and also some of their youngsters showed great performances. Most importantly, Ponitka never let me down in fantasy league.
Number 3
 It's too hurtful that we will not see Trinchieri in Top 16. They don't have the greatest roster but Trinchieri somehow made them roll anyway. Unfortunate for them, they were at probably the most challenging group at all.
Number 2
 Partizan... They were just amazing. If you look at the standings, yeah they may look like the worst team in the group. But, they were great for god's sake. They were the only team which show real resistence to big two(Barcelona&CSKA). It's shame that they won't be with us in next phases. Such a shame...
Number 1
 And the winner. Most likely, they have one of the most inexpensive roster. Yet, they proved that thet were quite capable of playing great basketball. They polished some of their players and I believe if they weren't in the Group A, they have a great chance to march on to Top 16. Even though they won't be able to play in the Top 16 phase, their fans would be delighted with their teams I guess.
First of all this is not Euroleague team power rankings. This team index formed by analyzing how the team's showed their performance against their opponents and how they stopped their opponents for every group game they played. Every statistic -whether about team's own performance or about how they handle their opponents - is awarded or penalized regarding their opponents normal Euroleague performance. So, if two team produced even identical statistics, the one with the tougher opponent would forge ahead.
Number 8
Cedevita Zagreb is the one who showed worst performance considering their opponent's performance. Probably, the fact that one of their opponents are one of the worst team in this list, played a great part in their place. They were way behind in the Top 16 race.Number 7
Number 6
Number 5
Number 4
Number 3
Number 2
Number 1
Tuesday, December 25, 2012
Mahmuti's Lineup Trouble
Black clouds are appearing for Anadolu Efes
again in top 16. Real, CSKA, Zalgiris, Pana, Efes and Malaga 6 teams 4 spot.
Can Efes get any spot? The hope is melting every day like Jordan Farmar. If the
standings are determined by financial powers, what will Efes’s rank? 3? yes 3. Again
same destiny (!) that is not changing over and over the years.
This year one of Efes’s problems is lineup
problem. Still no one knows what is Efes’s starting lineup or -more important- finishing
lineup even Oktay Mahmuti. It can be seen even with a quick overview.
There are some conflicts in Efes rotation
that effect to compose a regular lineup. Only Semih Erden’s spot is fixed. Special
thanks to Stanko and Estaban!
- Farmar issue!
- Savanovic or Kerem Gönlüm?
- There is no spot for Dogus Balbay?
- What happened to Kerem Tunceri in summer?
- There was no small forward until the arrival of Joshua Shipp.

When you look at the all Efes lineups you
directly see Jamon Lucas is most successful player(acc. +/- Per Poss. from
gigabasket.com). He is in the 7 of 9 lineups which is positive in acc. +/- Per
Poss. Efes is more succeeding with him.


When looking at the first round games, the most
used 5 is Farmar – Lucas Gordon – Sinan Güler – Dusko Savanovic – Semih Erden. They
played 40 minutes in total. 35 of them in games won which are game 2, 3 and 4. And
then what? After those games these 5 players played only 5 minutes. That is interesting.
Again games won 2, 3, 4 and 8 Farmar – Kerem
x 2 – Sasha – Semih played together 14 minutes. But they played 5 minutes in
the other games. Absolutely, Kerem
Tunceri’s injury effect that lineups minutes but also that is one of succeeding
lineup deserve more minutes in top 16.
There is an interesting situation in Dogus Balbay’s
status in team. Dogus was like a strawberry in a bunch of crap in summer in Eurobasket Qualification
with Turkish National Team. He played 1
game against Milano and waved towels until 9. Game.
Aaand the most shocking detail is coming. There is not
any lineup which played all 10 games. Not a single 5. It is the signal of
something I guess.
Oktay Mahmuti is one of my favorite coach in
the world but that team is not his team. But also he knew that when he signed
the contract in summer. He should figure out something until December 28
because there is no light at the end of the tunnel.
Kart Out.
Subscribe to:
Posts (Atom)