Sunday, May 5, 2013

#1 CSKA Moscow- Russians Have an Unfinished Business


After the last season, CSKA Moscow is in the Final Four again. As we all can remember, last game of the 2011-12 Season was devastating for the Russian Powerhouse. They may have lost great players from last season's roster, yet they are still one of the most dominating team in the European League. Let's start CSKA Moscow analysis with the team's roster.


In the last column, T-Con Ranks show the ranking of the player in terms of his tangible contribution. Remember these ranks shows the players place in only Final Four teams' players. CSKA has 3 player (Khryapa,Teodosic,Krstic) in Top 5 players and 1 more player (Weems) in Top 10 players. It's obvious that they have great Starting 5.

Next, we analyzed the all team's point guards' play making abilities. Let's look how good is the CSKA Moscow's commanders;


Remember, this stat show point guard's play making abilities. So, players which tend to create more offensive opportunities for his team mates get better scores.  We've found their ranking in both all-players of Euroleague and all-players of Final Four Teams. Papaloukas is at the top on Final Four list. Also, starting point guard Teodosic is one of the Top 3 point guards which shows CSKA would have the advantage for smoother offense in following games.

After play making abilities, shooting analysis is the next. We analyzed all players in term of shooting abilities and determined the Top 5 shooters for all teams. Let's find out who are the CSKA's top shooters.


There are two different type of Shooting Values (SV). First one (SV1) includes both 3-pointers and middle range shoots. They are weighted differently by their profits of course. MR Value and 3P Values are the values that shows weighted players' shooting accuracy by considering their opponent's shot-defending stats.  MR Vol. and 3PA Vol. represent value of how many shots players have taken to reach their field goal percentage. As I've mention in previous post, I've formed a shooting distribution to find these scores. Ranks are combination of these Shooting Values and Shooting Volumes. On the other hand, second Shooting Value (SV2) take only 3-pointers and volume of 3-pointer shoots into consideration.Same combination logic applied these stats to find 3-pointers ranks.

We also made a rebounding analysis to understand team's success at the rebounds.


I've mentioned in the Prologue post how we calculated rebound rates. When we look at the ranks, we can easily see that best rebounder of the Euroleague is in the CSKA's roster,Khryapa. They also have one more player who is one of the Top 10 rebounders in all Final Four players,Krstic. It shows, CSKA would probably have no problems in the front court.

It's time to shows how is CSKA doing in TDR and TOR rankings.

Table above, shows how CSKA's TDR scores changes while Euroleague advances and what was the average TDR scores in every phase they've passed. Till the Playoff, CSKA was always above the EL Av. Yet, they were under the average in the playoffs which is a little bit alarming for them. The graph below shows this progress.


As for offensive efficiency, TOR scores of the CSKA are showed at the table below.

Unlike TDR, CSKA was above the Euroleague average in every phase they played. Not only that, but also it's clear that they increased their offensive efficiency while the tournament advances.


Now, last but not least Play Oriented Winning Percentages. As I've mentioned before, these percentages are formed by developing team's play oriented winning function and comparing these functions to their opponent's functions.Thus, I was able to determine number of plays that are good and bad for each teams. Let's start with the first game of the CSKA;

Game Function shows the function of the CSKA Moscow vs Olympiacos games' function as the name implies. First Breaking Point (FBP) of this game  is 66 play per team. Second Breaking Point (SBP) of the game is 85 play/game. Let's find out how these breaking points chances teams' winning chances. That tells us between 66 number of play and 85 number of play CSKA has the advantage. Yet, below the 66 number of play ( which is almost impossible for a game to finish with that much low number of plays) and above 85 number of plays Oly gets the advantage.However, since Oly prefers low pace games, it would be harder for them to compete with CSKA. Now, let's look at the breaking points of other potential match-ups.


It seems that CSKA has its comfort zone between 60 and 85 number of plays. Euroleague average for this season is approximately 80 number of plays by the way which proves that CSKA fans has every rights to claim championship. 

_____________________________________________________________________________

*: Points
**: Possessions

Note: Every analysis ,which is conducted for all players of the Euroleague, is applied for the players who had played at least 15 game in the Euroleague this season.

Saturday, May 4, 2013

Prologue : Manuel for Final Four Analysis

Here we are, at the greatest stage of the European Basketball again. We are four games away from the end of the Euroleague's 2012-13 Season. Before the beginning of the greatest tradition of European Basketball (my subjective opinion), we've made series of unique analysis. But,before sharing them we prepared a manuel to make it easier to understand stats we used in final four analysis. Actually, we mentioned most of them in previous posts. Yet, it would be annoying to go back number of older posts to remember older stats,I believe. So, we decided to create this post.

Play

Play is a stat that we frequently use. We first talk about Play in T-Con Post. We use Play as an alternative for Possession. Basically, Play shows an offense which takes place between start of a shot clock and start of an next shot clock. Every move which resets shot clock time is considered as a Play. We give up using Possession,because Play fits better in our formulas since it includes every offense even the ones after an offensive rebound.

T-Con


T-Con is a tool that we used to measure players' tangible contributions in the game. It includes lots of data and formula and we showed how to calculate T-Con in a previous post. I will mention its general characteristics. First of all, I came up with T-Con since I've never believed in PIR. In T-Con, we evaluate every possible scenario and outcomes of these scenarios for every move a player makes. One of the greatest features of T-Con is it takes both team's and opponent's performances into consideration while evaluating a player's performance. For instance, players penalized for their missed shots by considering their team mates' shooting performance. If a player's team mates have a good field goal percentage, he would be penalized more than a player who has better field goal percentage than rest of his team.

T-Con has also some gaps like team success. Yet, since we are making analysis for four F4 teams and it would be logical to assumed that they have similar success rates, this problem doesn't effect us of now. But, we will integrate team success into T-Con later on of course.


Play Making Abilities

It is another long analysis. You can find stats that used to calculate Play Making Abilities in Who Runs the Show Better post. It basically measures play making abilities of team's point guards.

Rebound Rate

Rebound Rate for team's is not one of our stats. You can find it  in any other site. It shows how many percent of the rebounds in defensive or offensive rebound pool a team grabbed. We adjusted this formula to players by using minutes they played and plays they involved. It would be much healthier to calculate that numbers by using real numbers instead of adjustment. Yet, as I've said before, it is a gigantic problem
to reach some advanced numbers for Euroleague games sadly.

Shooting Stats


I've used some extra stats while measuring shooting abilities. One of them was Opponent's Strength. It shows, how opponents defends shots. Finding these numbers was crucial to measure hardness of shots and evaluate shooting performance. Another stat that I needed to use was Volume of the Shots. Since, great shooters tend to reach great numbers by using lots of shoots, number of shot attempts is very important for such evaluation. So, I've formed up the shooting function of the Euroleague Season 2012-13 Season by using shot attempt numbers. After that, I've form up probability density function for this system. Thanks to that, I've managed to integrate Volume of the Shots to the shooting evaluation.

Play Oriented Winning %

It's a whole new stat that we used in the Final Four Analysis for the first time. It shows which team has bigger chance to win the game according to pace of the game. There would be another post to introduce this stat extensively. Now, I'll just talk about main principles of it.

First of all, I've analyzed all games of the F4 teams in terms of number of plays and points made. Then, by using this particular data set, I've created  Winning Function for each team. After, I've started to compare every team with each other. I've determined winning zones for each team by number of plays they made by using these comparisons. For example, more defensive teams prefer making lesser plays and force their opponents to do the same. So, in a low pace game (in which lesser number of play occured), defensive teams has bigger advantage. On the other hand, if number of play tends to increase, then winning chance of a defensive teams decreases while more offense oriented teams' increases. Hence, this functions show how should any of these four teams adjust pace of the game to increase their winning percentage.

Wednesday, April 17, 2013

Defending The Rim

How we can measure defense in the paint with basic stats. Lay-ups-dunks, rebounds, blocks else? These are some stats that can provide an insight about which team defends the rim better. 

Who allows more close range shots and what is these shots success percent? Which team gives more offensive rebounds? Who rejects more shots in a game? The answer of all these question is related with opponents and games paces', right? Pure numbers are not enough for comparison. Giving 10 close range shot attempts  against CSKA should not equal with giving 10 shots against Alba. All teams offensive strategies and strengths aren't same. Oly tried 27 close range shots per game in TOP 16, Maccabi 17. Important thing is here to take your oppennets' numbers down. Allowing 10 buckets can be better than allowing 8 buckets with respect to your opponent. As well as we have to adjust stats with how many plays did opponent in the game. More pace means more shots that means more rebounds more buckets or more chance to blocks. And also stats should be combined to reach one rate. You can't sum up shots and rebounds directly. Thus we took all stats to one common base, same logic with TDR.

Firstly, we adjusted all numbers with plays and found distance between opponents' averages and performances of that opponents' against selected team. For example, Real Madrid allowed 13,05 close range shot per game in Top 16 however opponents of Real made 15,98 shots in the other games(numbers are play adjusted). After done this calculation for all teams and selected stats, we found teams places in between all with normal disturibution. And we multiplied nolmal disturibution value with coefficients to bring them all to point base. After all we summed stats and reached the rates. Here are the results.

click on the picture for bigger view


Tuesday, March 19, 2013

TDR Ladder Week 11

 Here is Team Defensive Rating* Ladder based on teams' TOP 16 defensive performances. 


* We adjusted some details. That is more proper.

Sunday, March 17, 2013

Who Played the Best? (Measuring Players' Contribution)

In this post, I'll introduce you a brand-new, 100% textbook stat, 
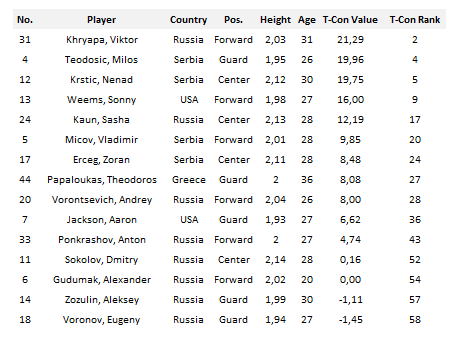
T-Con [1]. It's designed to measure players' contribution in a game. Currently, Performance Index Rating -PIR-  is used to evaluate players efforts in the game and even to choose MVP of the Week in Euroleague. Yet, I've never get used to concept of PIR since I encountered it. Its algorithm fairly   inadequate to evaluate different stats and combine them.So, we decided to solve that problem.

First of all I tried to bring all stats into one common base -points-, as TDR and TOR. It was a little with tricky this time, because it's more complex to evaluate pluses and minuses of a player's move than a team's move. For example, in the simplest term team shots with one field goal percentage as an organism while every player has his own field goal percentage regardless of his team mates.So, every shoot differ from each other depends on who use it. I'll expand on that a little later. Before that, let's remember what we have in a boxscore sheet; Points, Field Goal and Free Throw Attempts[2], Assists, Steals, Turnovers, Rebounds,Blocks[3], Fouls Received and Committed. In order to evaluate numbers in these stats we need to form up a few more stats too. I'll mention them while I'm explaining how I value the numbers in the stats above to avoid confusions. Let's start with Points.

Points may be the most crucial entry in the boxscore since the fate of a game decided by how many points a team made. Value of a point changes slightly game by game. Points made in a low score game are more valuable considering its sample. Also, every point ,scored in a game which ended with lower score difference, is more important. So, first I determined the points should be scored -by any player- per minute to win the game. Then, I calculated Expected Points for any player by considering corresponding minutes played and calculated difference between expected points and points made -Marginal Points-. After that, if marginal points of a players is less than '0' -which means points made are less than expected points- I used points made as Point Component of T-Con. On the other hand if marginal points of a player is greater than '0', I made a final calculation. I calculated the importance of a point[4] by considering score difference at the end of the game. Afterwards, I valued every points made which exceeded the expected points with this importance. This final calculation yielded a result which I've chose to call Value-Added Points. I sum up points made with value-added points and took result of it as Point Component of T-Con.

Next stat we need to evaluate is Field Goals Missed. Before that, I need to mention concept of Projected Score per Play,PSP[5]. Basically, PSP represents estimation of how many points would a team score in a play[6]. Now, let assume Player X, missed the shot. If he didn't use and miss the shot, his team mates would attack with PSP(TwP[7]) which is calculated by taking his team mates field goal percentages,turnover and getting fouled rates. Since, Player X prevent his team to score PSP(TwP) many points, he should penalized as many as that. Missed shots time PSP(TwP) -multiplied with '-1' of course- would be Field Goal Missed Component of T-Con.

Next stat is Free Throws Missed. It's not too hard, since every missed free throw attempts worth 'Minus 1' points, I took missed free throw attempts time 'minus 1' as Free Throw Missed Component of T-Con.

As for Assists, I used one of the stats we've introduced before,FGT. Briefly, FGT is potential score of shot -not a play,just shot-. Since every assist means a field goal made , we don't need to use field goal percentage for an assist. I multiplied players assist numbers with team's FGT(TwP) to calculate Assist Component of T-Con.

Now, lets analyze Steals. Steal is characteristically a play reverser stat. What am I trying to say is, a steal prevents opponent's one play and makes it your play. So, we need to consider benefits of the both sides while evaluating steal. So, value of a steal would be summation of opponent's PSP -which you stop- and team's PSP -which you lead-. Multiplying this summation with number of steals would yield Steal Component of T-Con.

One of the stats which shows great resemblance to steal is Turnover. Turnover also tends to be a play reverser stat. It's not quite the same as steal though. Not all turnovers leads transitions. For example, if Player X stepped out of bounds, it wouldn't cause an transition offense for opponent team. Yet, if Player X lost ball because Player Y of opponent team stole his ball, then it would yield an transition offense for opponent team. Therefore, we need to find the ratio of how many of the team's turnovers are caused by opponent's steals -S/T Ratio-. After that, we can safely presume that as much as S/T Ratio, play would be reversed and team would lose as much as its PSP and opponent would score as much as its PSP. Also,team would lose the ball but not hand it over to opponent for that play as much as rate of '1-S/T Ratio' . To sum up, we need to multiply S/T Ratio with summation of Team's PSP(TwP) and Opponent's PSP and and multiply 1-S/T Ratio' with Team's PSP(TwP) and then sum these two outputs up and multiply with '-1'  -to penalized turnovers- . It'll give us Turnover Component of T-Con.

Rebounds are divided as defensive rebounds and offensive rebounds. Let's start with Defensive Rebounds. Let's assume that Player X grabbed 5 defensive rebounds. How can we value that effort? First of all, if he didn't show that effort and grab the ball, those rebounds would be shared between Player X's team mates and players of the opponent team. Since Player X would be out of the picture, probability of his team's grabbing rebound would decrease. It means that, some of Player X's '5' rebounds -let's assume 2 of them- would be grabbed by opponent. So, opponent would attack with its PSP(2C[8]) for '2' times. PSP(2C) times '2' would be value of the Player X's defensive rebound effort which is Defensive Rebound Component of T-Con. As for Offensive Rebounds, we can use similar logic. Let's assume Player X grabbed 4 offensive rebounds this time. If he didn't show that effort, these 4 offensive rebounds would be shared between his team mates and opponent's players. In this scenario -like previous one- Player X's team would grab less offensive rebound - let's assume 1 of 4- since Player X would be out of the picture. So, they would lost the chance of attacking with their PSP(2C) for '3' times - '4-1=3' -. Therefore, '3' times Team's PSP(2C) would give us value of Player X's offensive rebound effort which is Offensive Rebound Component of T-Con.

One of the remaining stats is Blocks. Since it's impossible for me to reach data of how much percentage of blocks made behind the arc, I assumed that all blocks happens in 2-Pointer area. I know, sometimes blocks happen behind the arc, yet that numbers seems very insignificant to me -by considering sample size-. Also, I didn't want to overrate blocks, since sometimes block attempts leads teams to poor defenses. So, here is what I did, I multiplied number of blocks with opponent's 2-Pointer percentage and '2'. Then, I took it as Block Component of T-Con.

And last of all, Fouls. Let's start with Fouls Received. Let's assume our mighty Player X is get fouled. If he couldn't go to free throw line, there would be no extra benefits to his team since his team would attack with its regular PSP as usual. However, if he manages to go to free throw line he would add as many point as he scored in free throw line. To calculate that number we need the frequency of player's getting to free throw line per foul, line%. After that, we can easily calculate Fouls Received Component of T-Con. As for Fouls Committed, I've used same logic. Since, most of the players has a greater free throw percentage than field goal percentage, committing too many fouls would hurt the team. But again, we need to use opponent's line % since not every foul resulted with free throws. Then, I used the same calculation in fouls received and found Fouls Committed Component of T-Con.


After all these calculation, we can finally evaluate all stats and combine them. Because, they are all in the same base now and all of them are weighted by calculating how much they help or hurt. We would share application of T-Con for some games -Euroleague's Games of the Week maybe- later on.

_____________________________________________________________________________

[1]Tangible Contribution; T-Con only measures efforts which is represented in the boxscore sheet. Remember, not all efforts is written in boxscore, we are well aware of that and we don't claim that T-Con represents all efforts, but it represents all efforts which are reflected by numbers. We're working on "numberless efforts" also, but they are not in the T-Con.

[2]Since Field Goals Made and Free Throws Made are being evaluated in Points Component, I've just used Missed Attempts for these components.

[3]Even though Blocks Made shows defensive effort, Blocked Attempts doesn't show any extra poor offensive effort than a simple missed field goal, I' believe. Since, we evaluated every Blocked Attempts in Field Goal Missed Component, I didn't form up a new component just for Blocked Attempts.

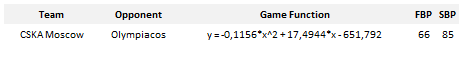
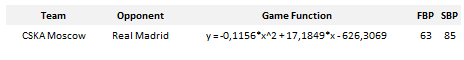
[4]Triangle of Win; Tie in the score represent a line which can be formulated as f(x)=x, in X-Y dimensions. Every score which breaks the draw, created a triangle between f(x)=x line and new position of score in X-Y plane. Median of this Triangle of Win, shows the importance of a point.

[5]PSP is found by summing up outputs of every possible scenario in a play. Every play can be ended with a field goal attempt, a turnover or a foul. Calculating percentages of these options and their possible outcomes -as points- would yield PSP.

[6]Play is a little bit differentiated version of a possession. Every offense which set a new shot clock equals a play. (It's not the same play as Dean Oliver's)

[7]Team Without Player; it shows the stat which is written before TwP is calculated by ignoring players' own stats and using only his team mate's stats.

[8]Second Chance;  since statistically probability of scoring is higher in second attempt, second chance PSP would be much higher than regular one.